Chapter 5 Results
5.1 Time and Moves
How does time and the quality of moves correlate?
We can first start by considering the simple case.
5.1.1 Time and Time Spent by Move Type
The following distributions relate Time and Time Spent to the types of move people make.
This graph provides a very unique insight to the correlation.
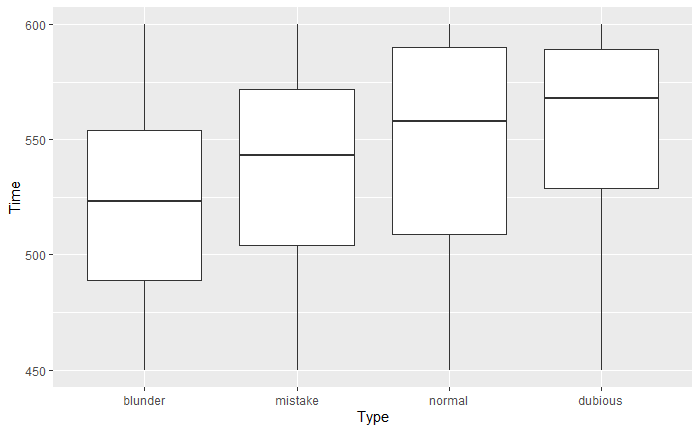
5.1.1.1 Time
For Time:
Normal moves had the biggest std as expected.
People had less Time after they made a blunder or mistake
Dubious moves were mostly made in the first 40 second of the game.
- This may imply that dubious moves are part of the opening.
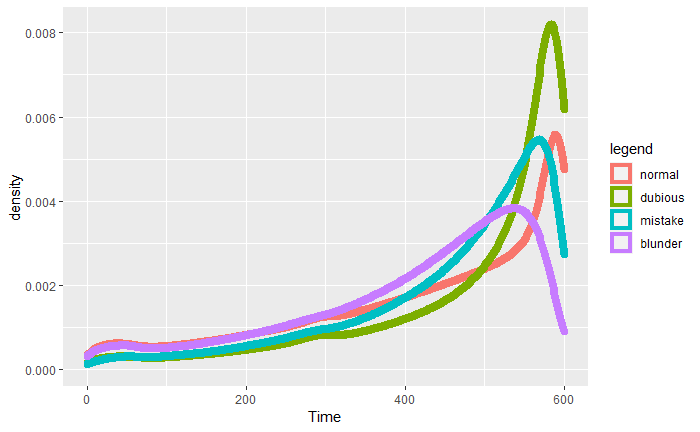
When the time left reached 5 minutes and 1 minutes, sudden fluctuations were found for the count of moves
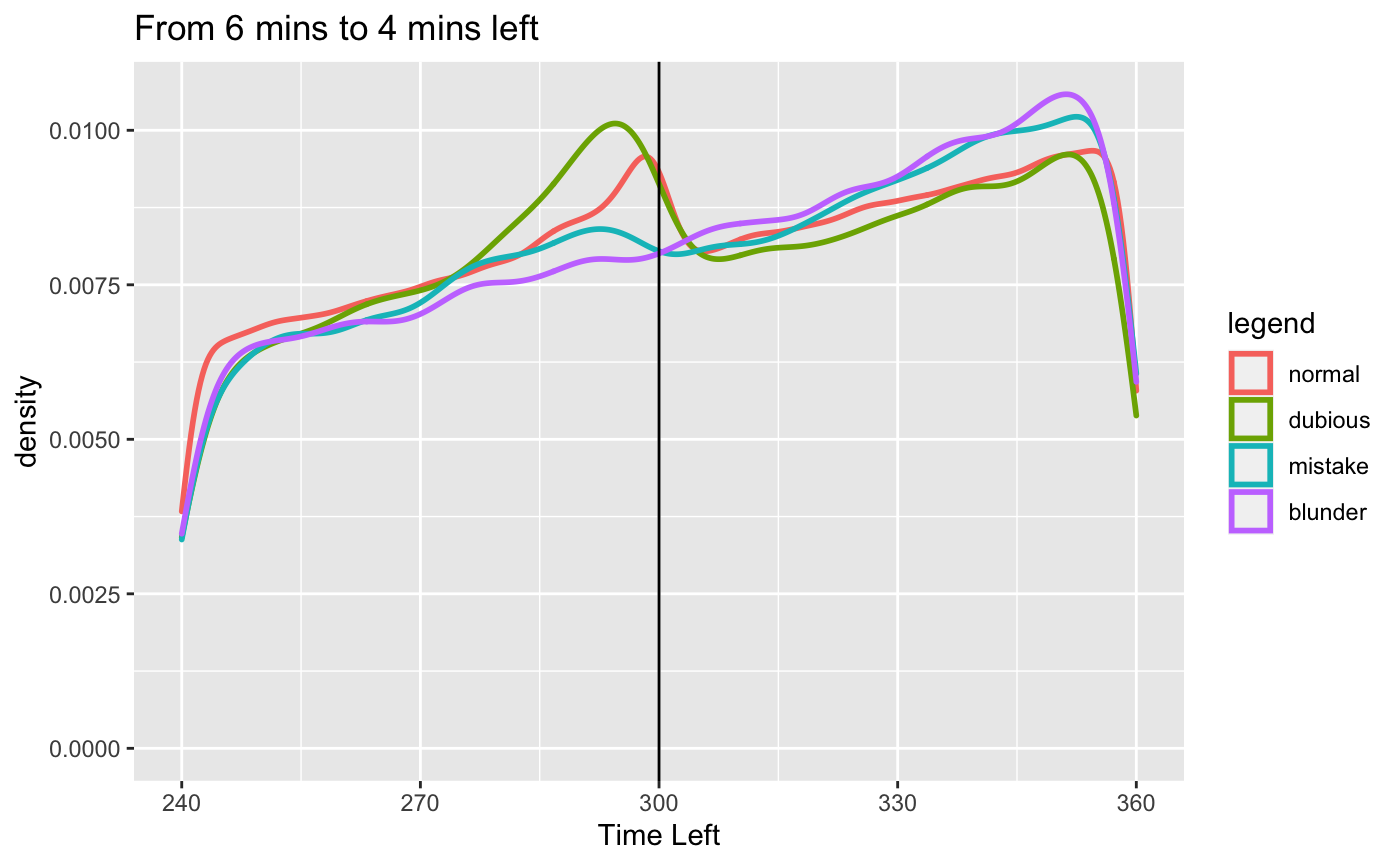
It is believed that 10 seconds, 1 minute and 5 minutes acted as a psychological catalyst that urged players to make a move
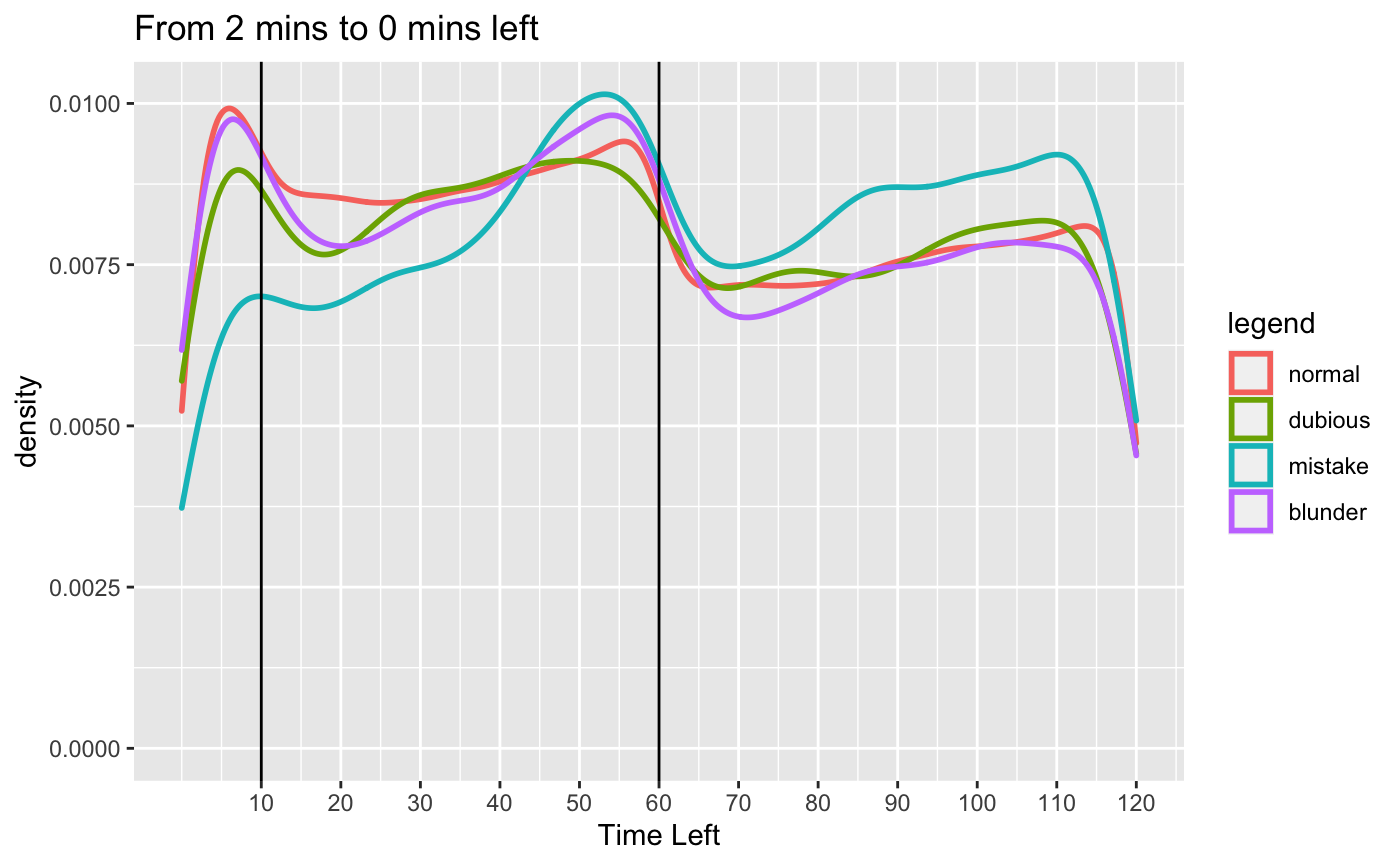
For both fluctuations at 5mins and 1min, we can see the curves for normal moves peak earlier than the other type of moves and the other moves almost peaked at the same time. However, dubious moves happened the most when there are 5 minutes left while mistake moves happened the most when there is only 1 minute left.
When the time left was less than 10 seconds, the distribution of the moves changed. Normal moves were made the most.
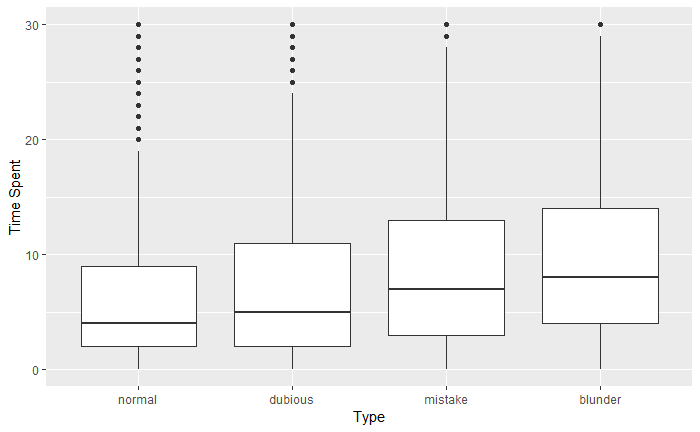
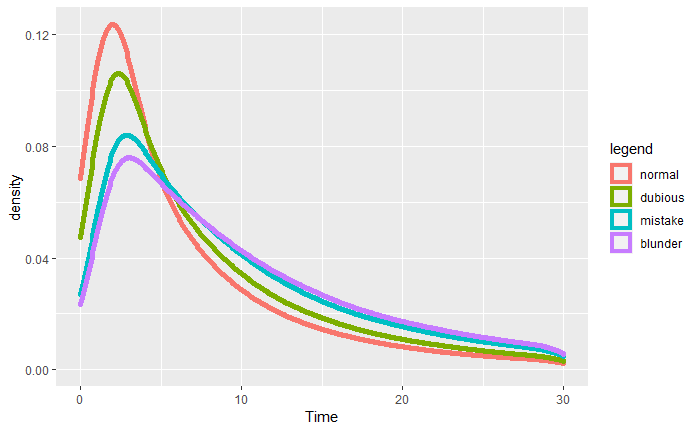
5.1.1.2 Time Spent
For Time Spent:
Normal moves were made fast.
Normal moves may be obvious given the position
Normal moves may be automatically played during the opening.
Blunder took more average time than any other type of move.
- This was less obvious. We expected blunders to be made fast without thought.
Mistakes also took more time than the average normal moves.
This is a heatmap of Time - Time Spent per type of move.
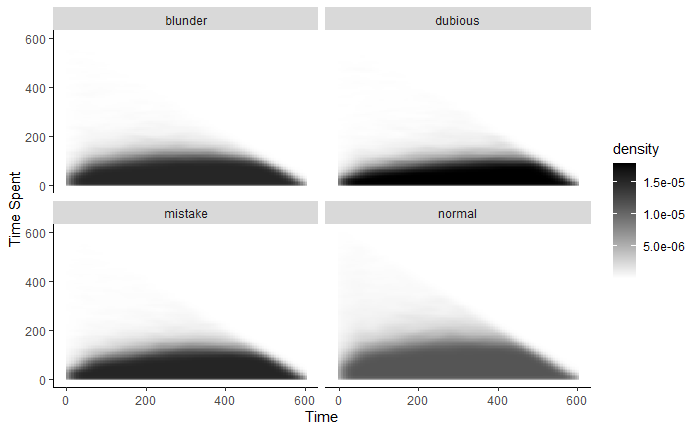
It became evident that people play bad moves early in the game
5.1.2 Time ratio by Move
We defined ratio = Time Spent / Time.
This concept of ratio reflects the relative sense of time and helped us to understand whether the player could have spent more time considering the position.
For instance, with 1 second of time left, the player made a move in 1 second. Then there is less possibility that the player would have found a better move.
However, with 60 second on the clock, the player made a move in 1 second and blundered. This is a terrible decision and the player should have spent more time thinking before they made the move.
##   X    Type      mean       std
## 1 1 dubious 0.1424937 0.1303141
## 2 2 mistake 0.1668489 0.1409064
## 3 3 blunder 0.1771698 0.1542783
## 4 4  normal 0.2248049 0.1818782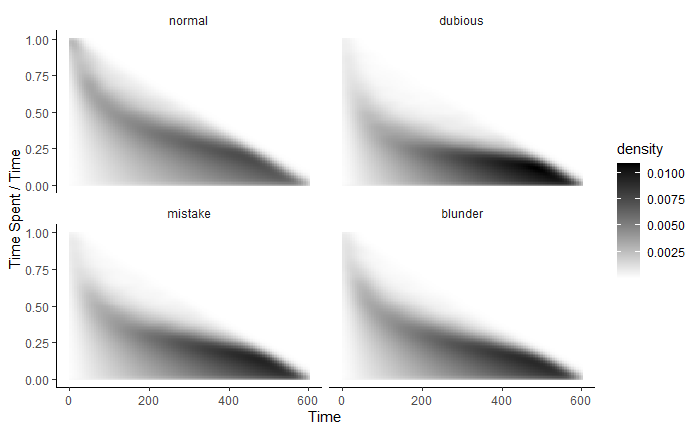
From this graph,
The mean of normal moves were much higher than other moves.
- Normal moves are a result of higher ratio of Time Spent / Time.
Dubious moves were most likely intended or a result of bad understanding early on in the game.
- This is consistent to the idea of Dubious moves happening in the early stages of the game.
Mistakes and blunders were also a result of not spending enough time.
- Players could have spent much more time thinking about the position and not blundering.
5.1.3 Quality of move during low time
Players have to make decisions in a short period of time and the quality of decision is related to time. Using Time ratio is one of the ways to study the relationship. Thanks to the computer evaluation made to each moves, we can use the Eval and EvalDiff from the dataset to quantify quality of move and the difference in quality of each pair of moves.
The result of this section would give insight to players that what piece would have better odds of having a higher evaluation under low time. Here’s the summary of the statistics:
##    X         X...EvalDiff          X.....Eval
## 1 NA Min.   :-150.92000   Min.   :-152.6500
## 2 NA 1st Qu.:  -0.31000   1st Qu.:  -2.0000
## 3 NA Median :   0.00000   Median :   0.1400
## 4 NA Mean   :   0.00394   Mean   :   0.3011
## 5 NA 3rd Qu.:   0.31000   3rd Qu.:   2.8400
## 6 NA Max.   : 150.47000   Max.   : 152.6500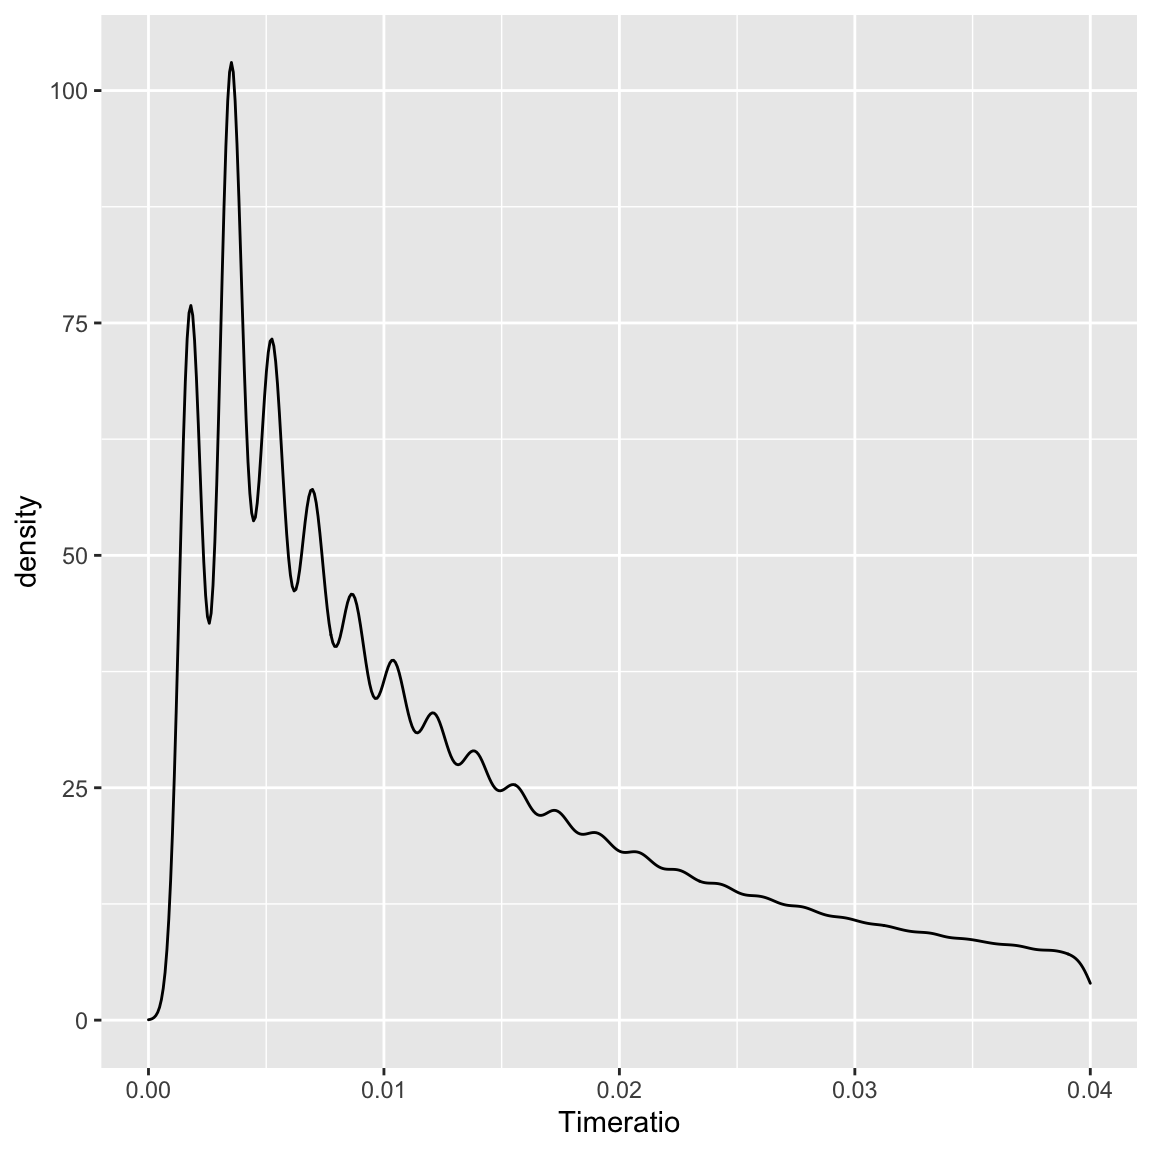
To represent low time with Time ratio, a specific range was chosen [0,0.0025] since we found that from 5.1.2 and the above graph that the majority of Time ratio is from 0.0015 to 0.01. Thus, one-forth of 0.01 was used to represent low time.
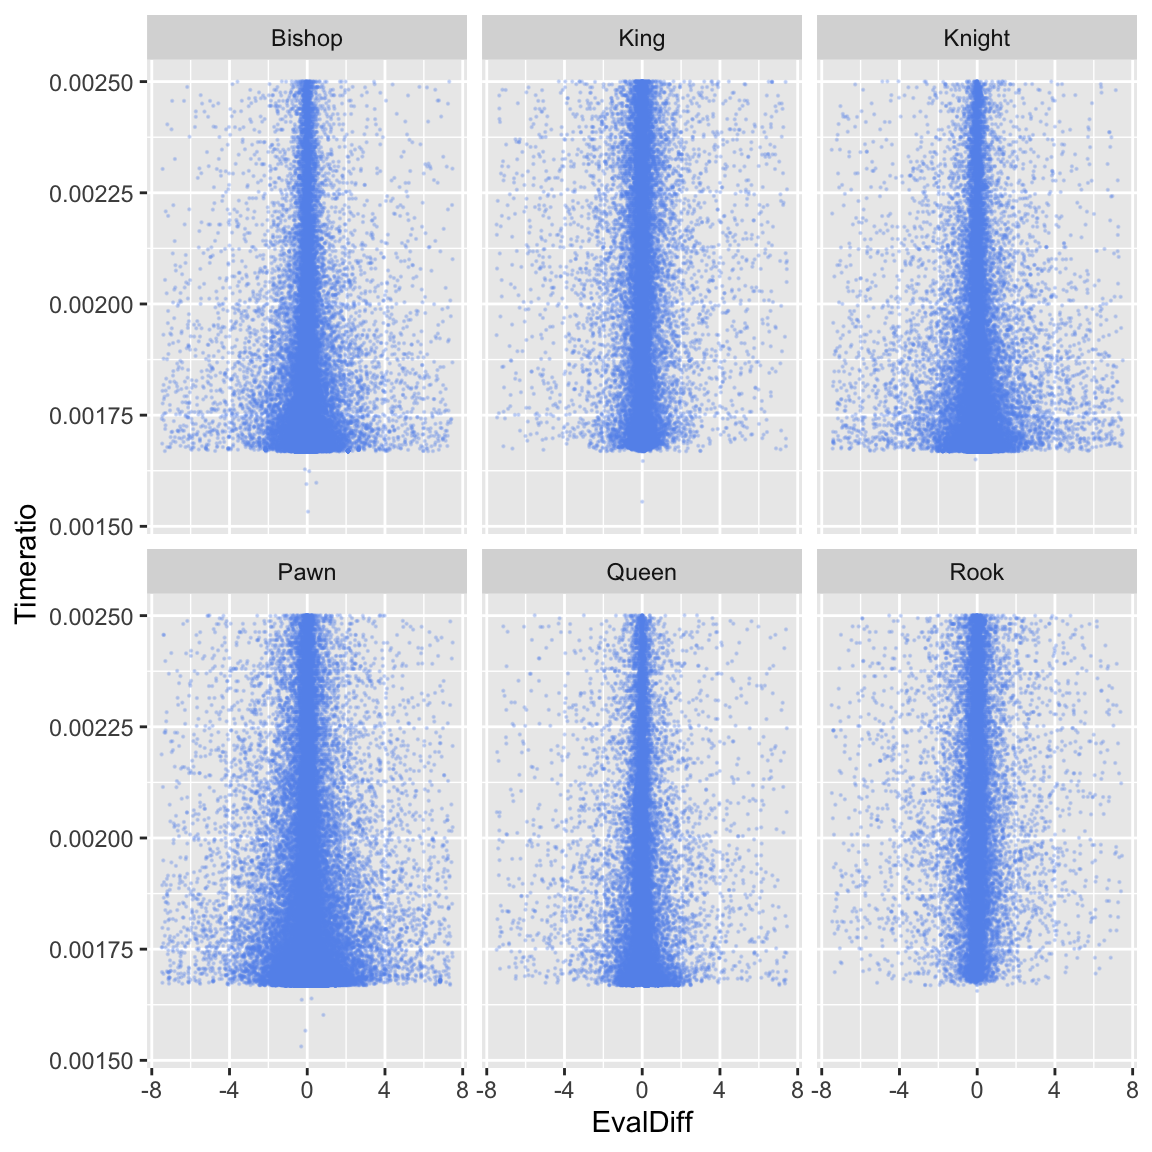
Within the time ratio of 0.0025, it was found that Evaluation difference increases as the time ratio decreased further for most pieces except rook. Which means the advantage of moving a piece in a lower time ratio would be better.
Comparing the six pieces, Pawn had the highest odds of being a high quality move, followed by Bishop and Knight
Thus, when the player has to make a quick decision with very less time left, Pawn and Bishop should take piority.
However, it was noticed that when time ratio decreases to 0.00165, the evaluation difference almost reduced to zero. Thus, it is not recommended to make a move with a very low Time ratio.
5.1.3.1 Quality of moves by piece when remaining time is low
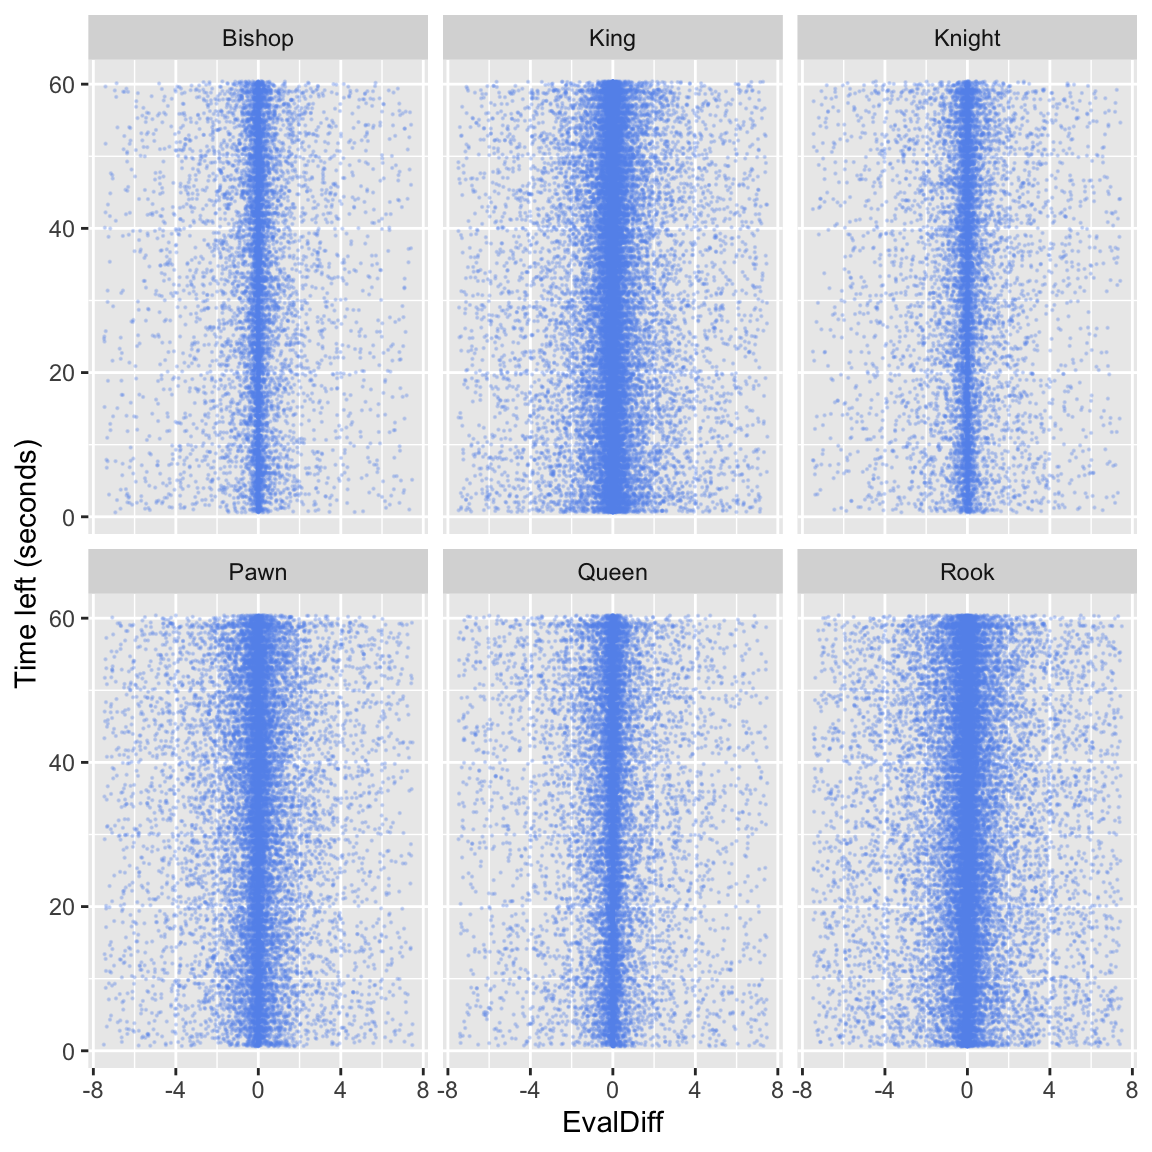
Taking the perspective of Time left, it was different from the Time ratio graph. There was no significant increases in EvalDiff as the time left was reducing from 60 seconds. However, we could still find out moving which piece would yeild the highest possibility of a better evaluation.
King had the highest Evaluation, followed by Rook and Pawn. Bishop and Knight should be avoided to be used when remaining time is low as they have the lowest Evaluation difference.
5.1.3.2 Quality of moves by piece when time spent is low
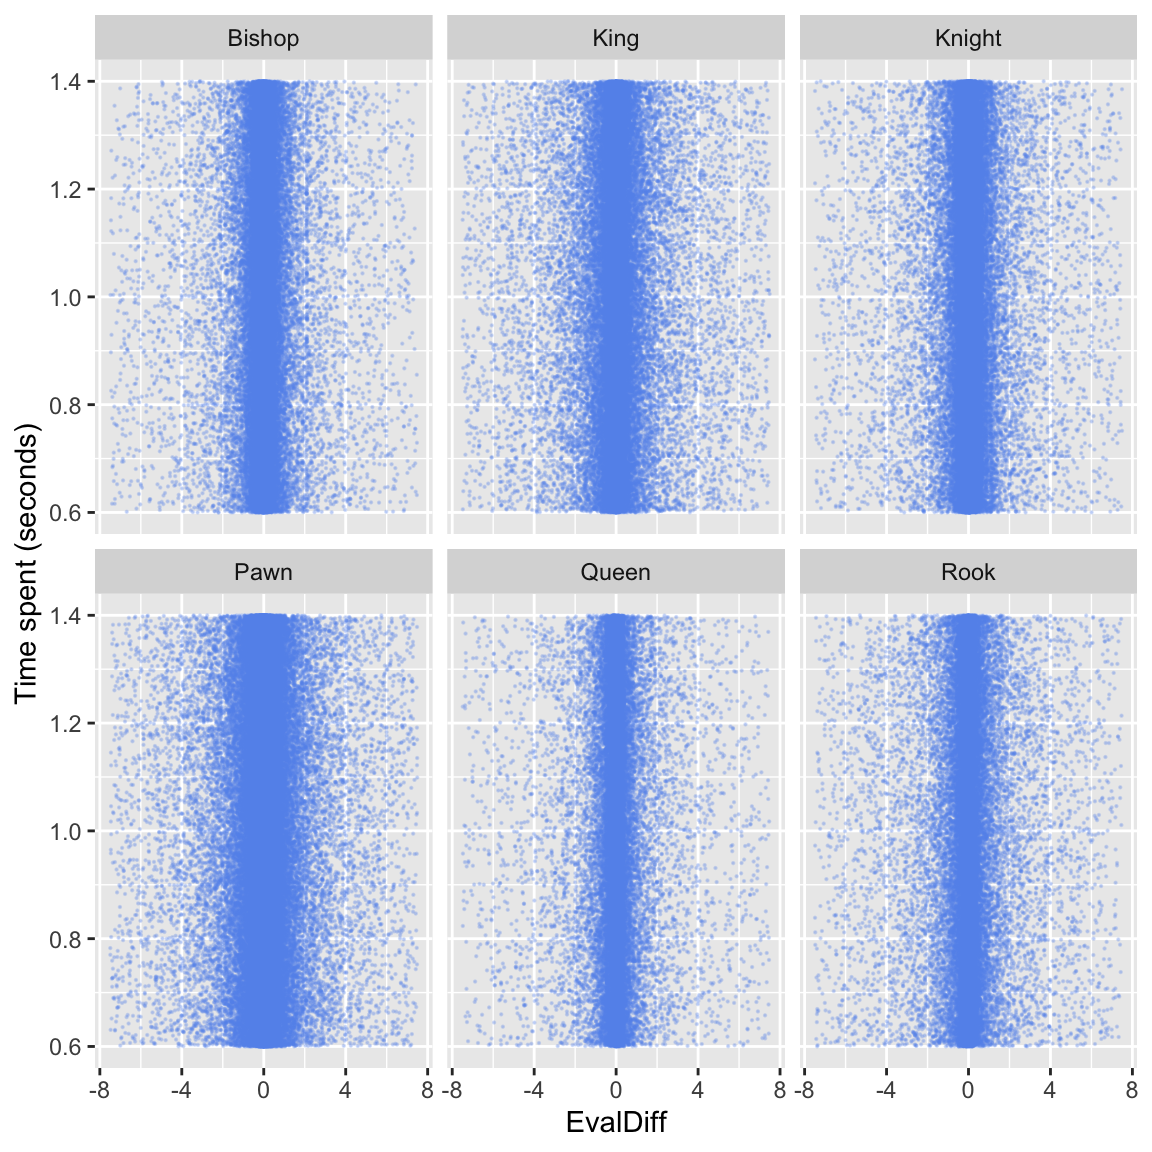
- It was found that the lowest time spent on a move would be around 0.6 seconds. Again, unlike the time ratio graph, the span of Evaluation difference stays the same . However, in contrast to the previous graph, Pawn is statistically the best pick for move if the player wants to make a quick response, followed by King. Queen should be avoid to use when a quick response is needed as the Evaluation difference is the smallest.
5.2 Investigating how the games ended
Most of the games end normally with results of either one of the players win or the match is tied. However, we see that over 10% of the games ended with someone ran out of time.
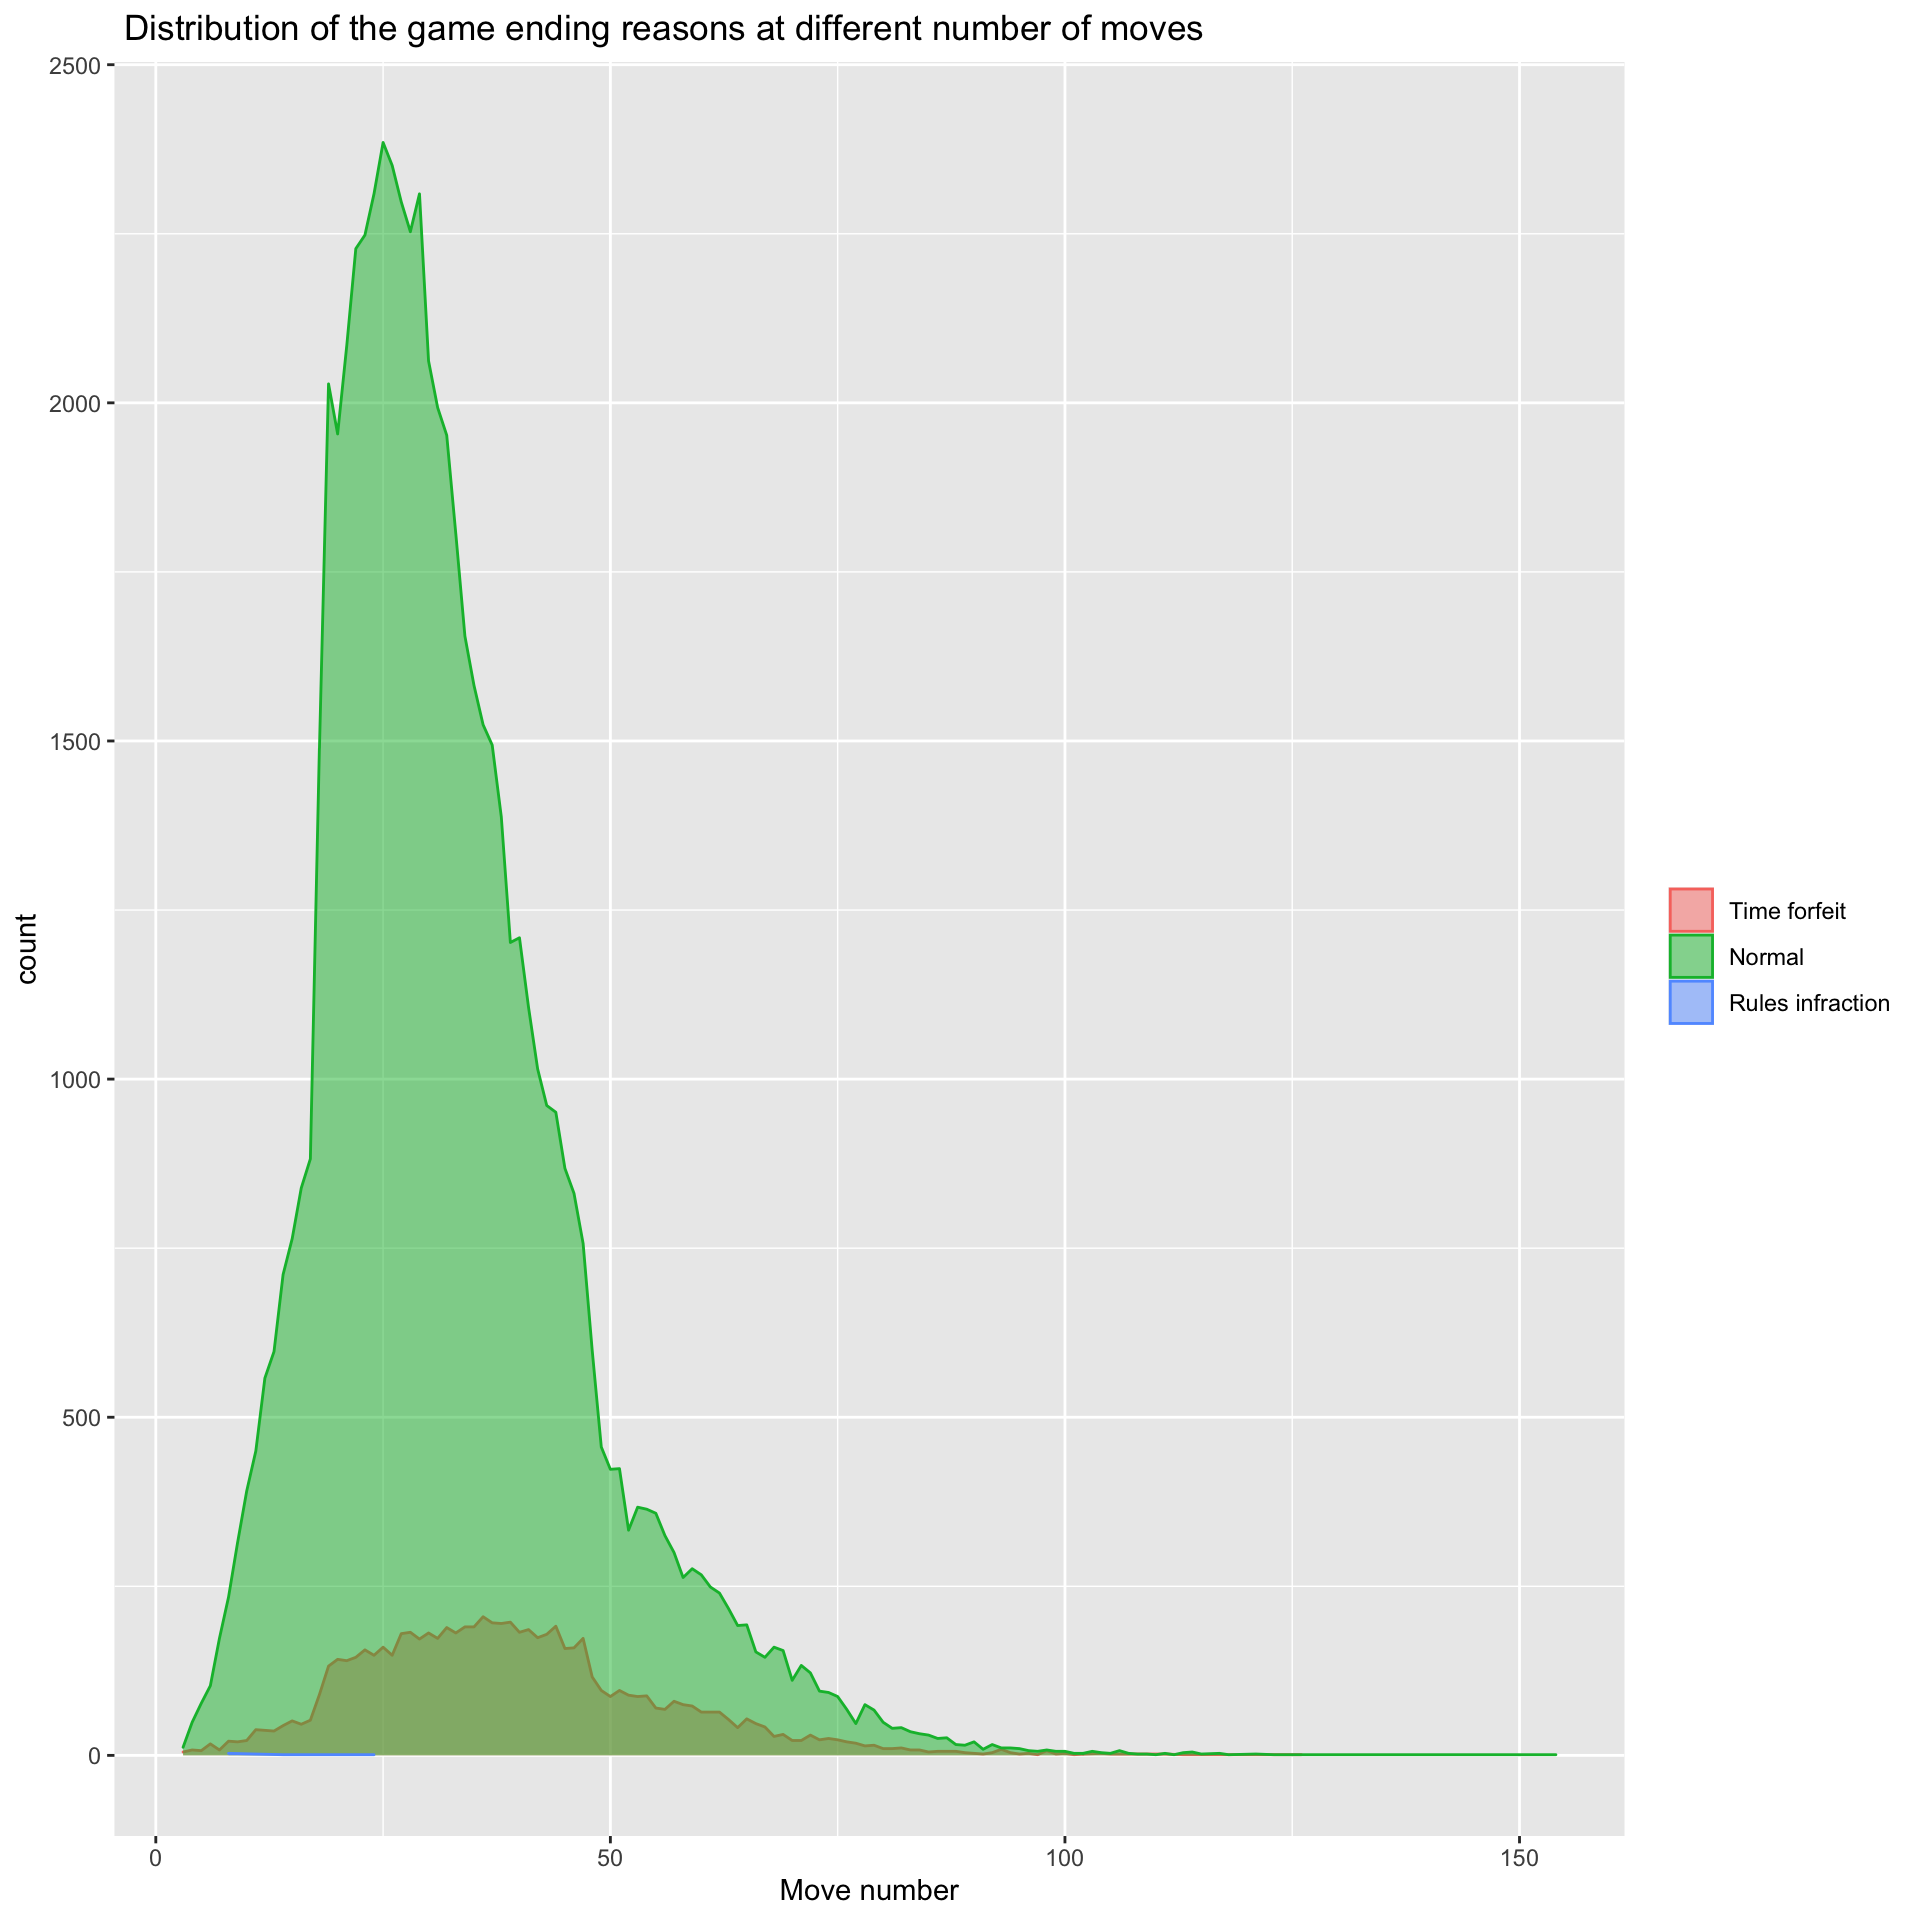
From this graph,
The majority of matches ended within 25 moves, however, matches that end with one player ran out of time were mostly happening at 35 moves.
Number of matches ended with the reason of rules infraction is neglectable.
2D density graph for time left vs time spent for the last move
 From this graph,
Most Time ratio lies between 0.1 and 0.01 when it is the last move.
We could see the most densed area of graph happens when time left is less than 25 and time spent is less than 1.25. That shows when it comes to the last move, the time left is no more than 25 seconds and the time spent is no more than 1.25 seconds.
Moreover, another peak occured when remaining time was around 225 seconds. That tells a large number of games ended during that amount of Time left
Another way to see it, majority of the games end around Time ratio = 0.1 and 0.01
5.2.1 Use of pieces at the end game
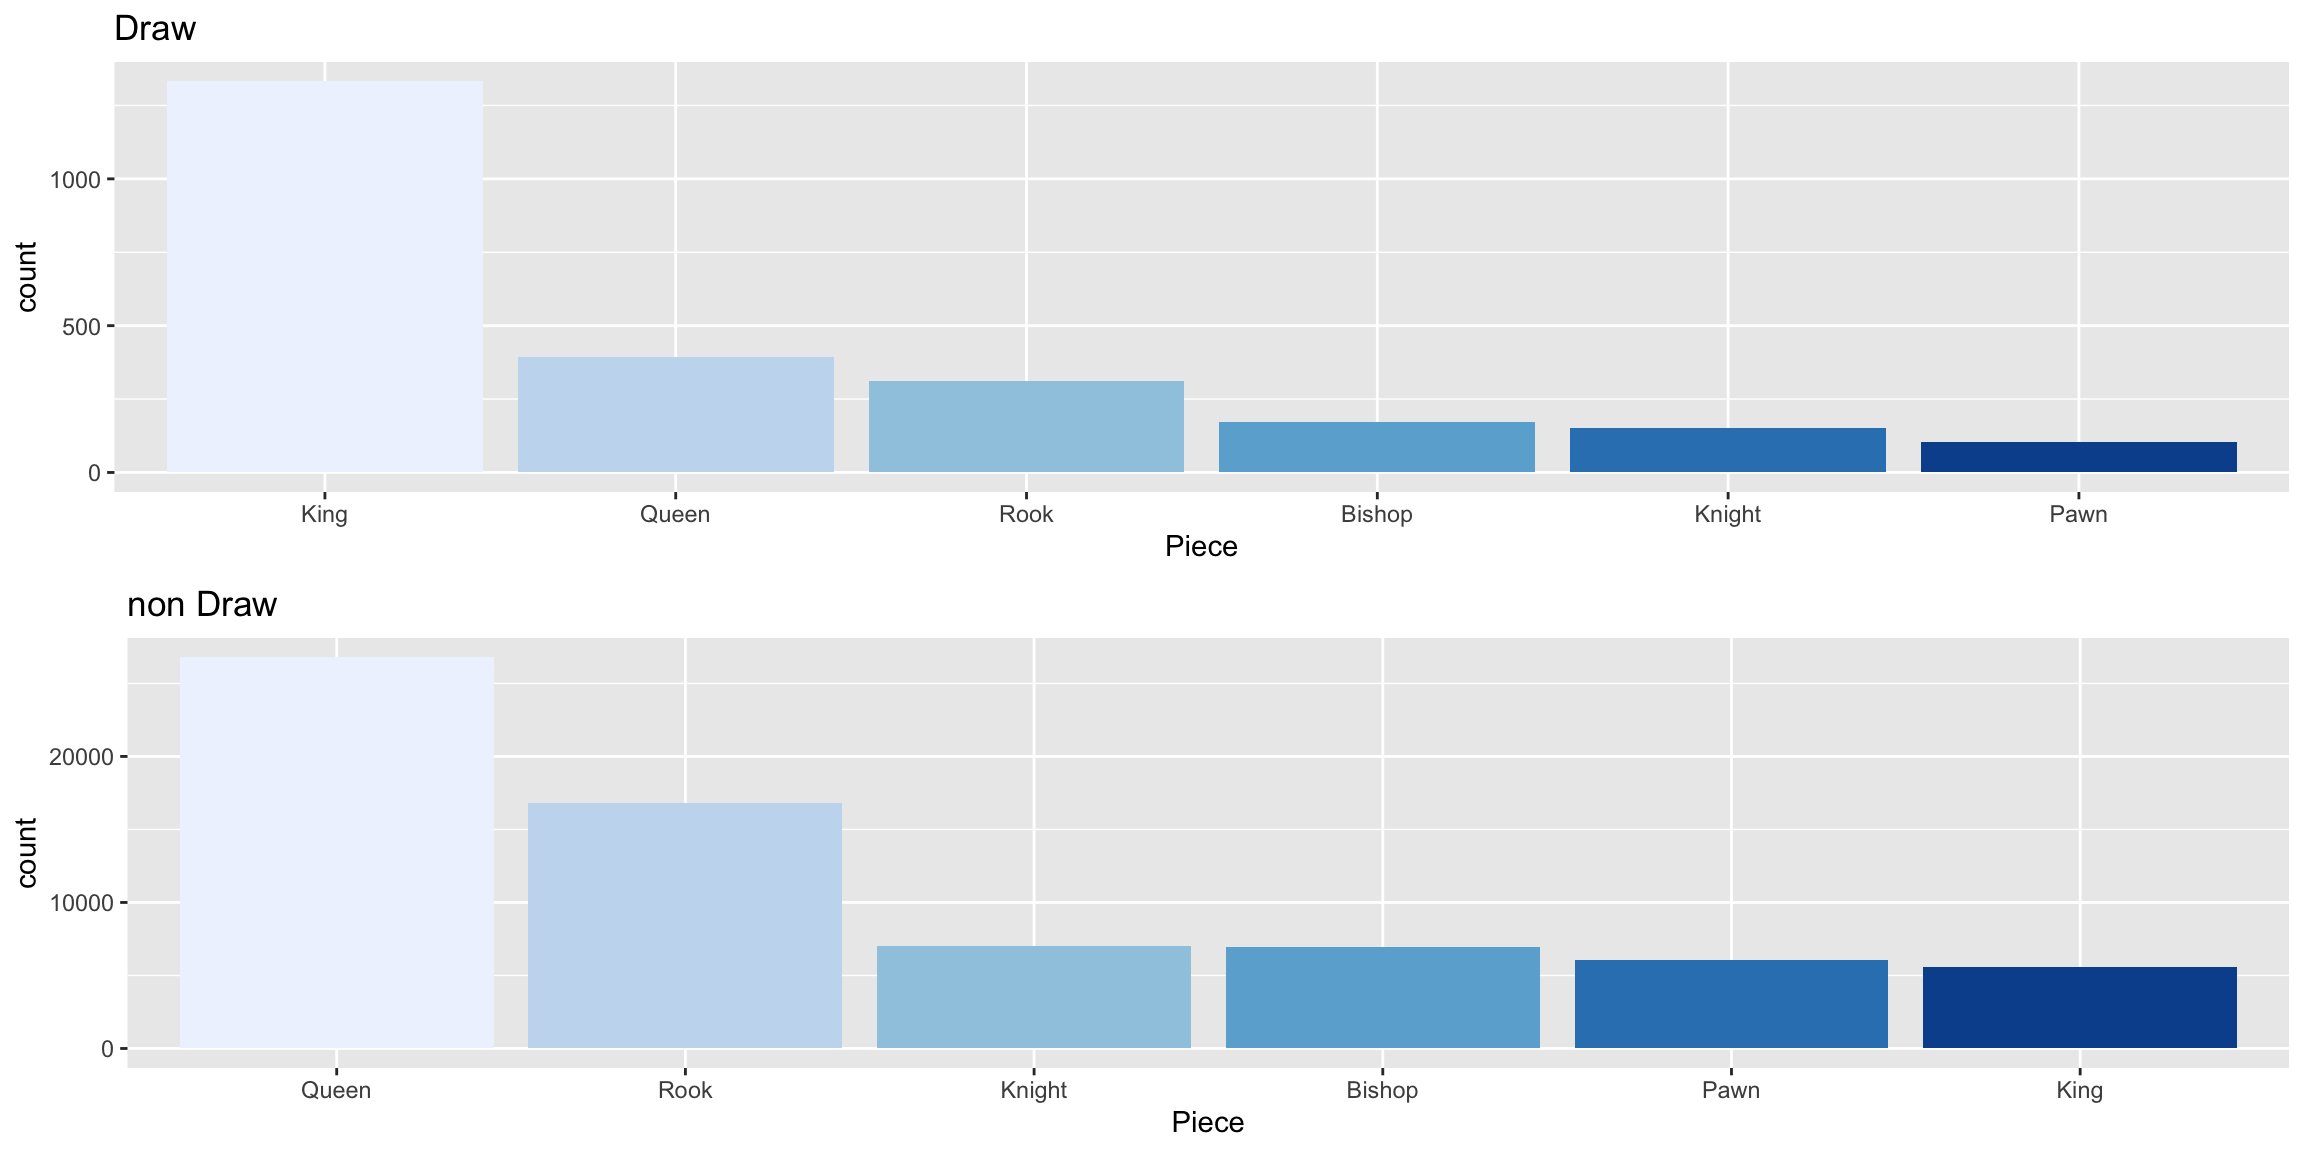
The majority of non draw games ended with Queen being the last piece to move, followed by Rook. However, in draw games, King and Queen are most frequently used pieces for the last move.
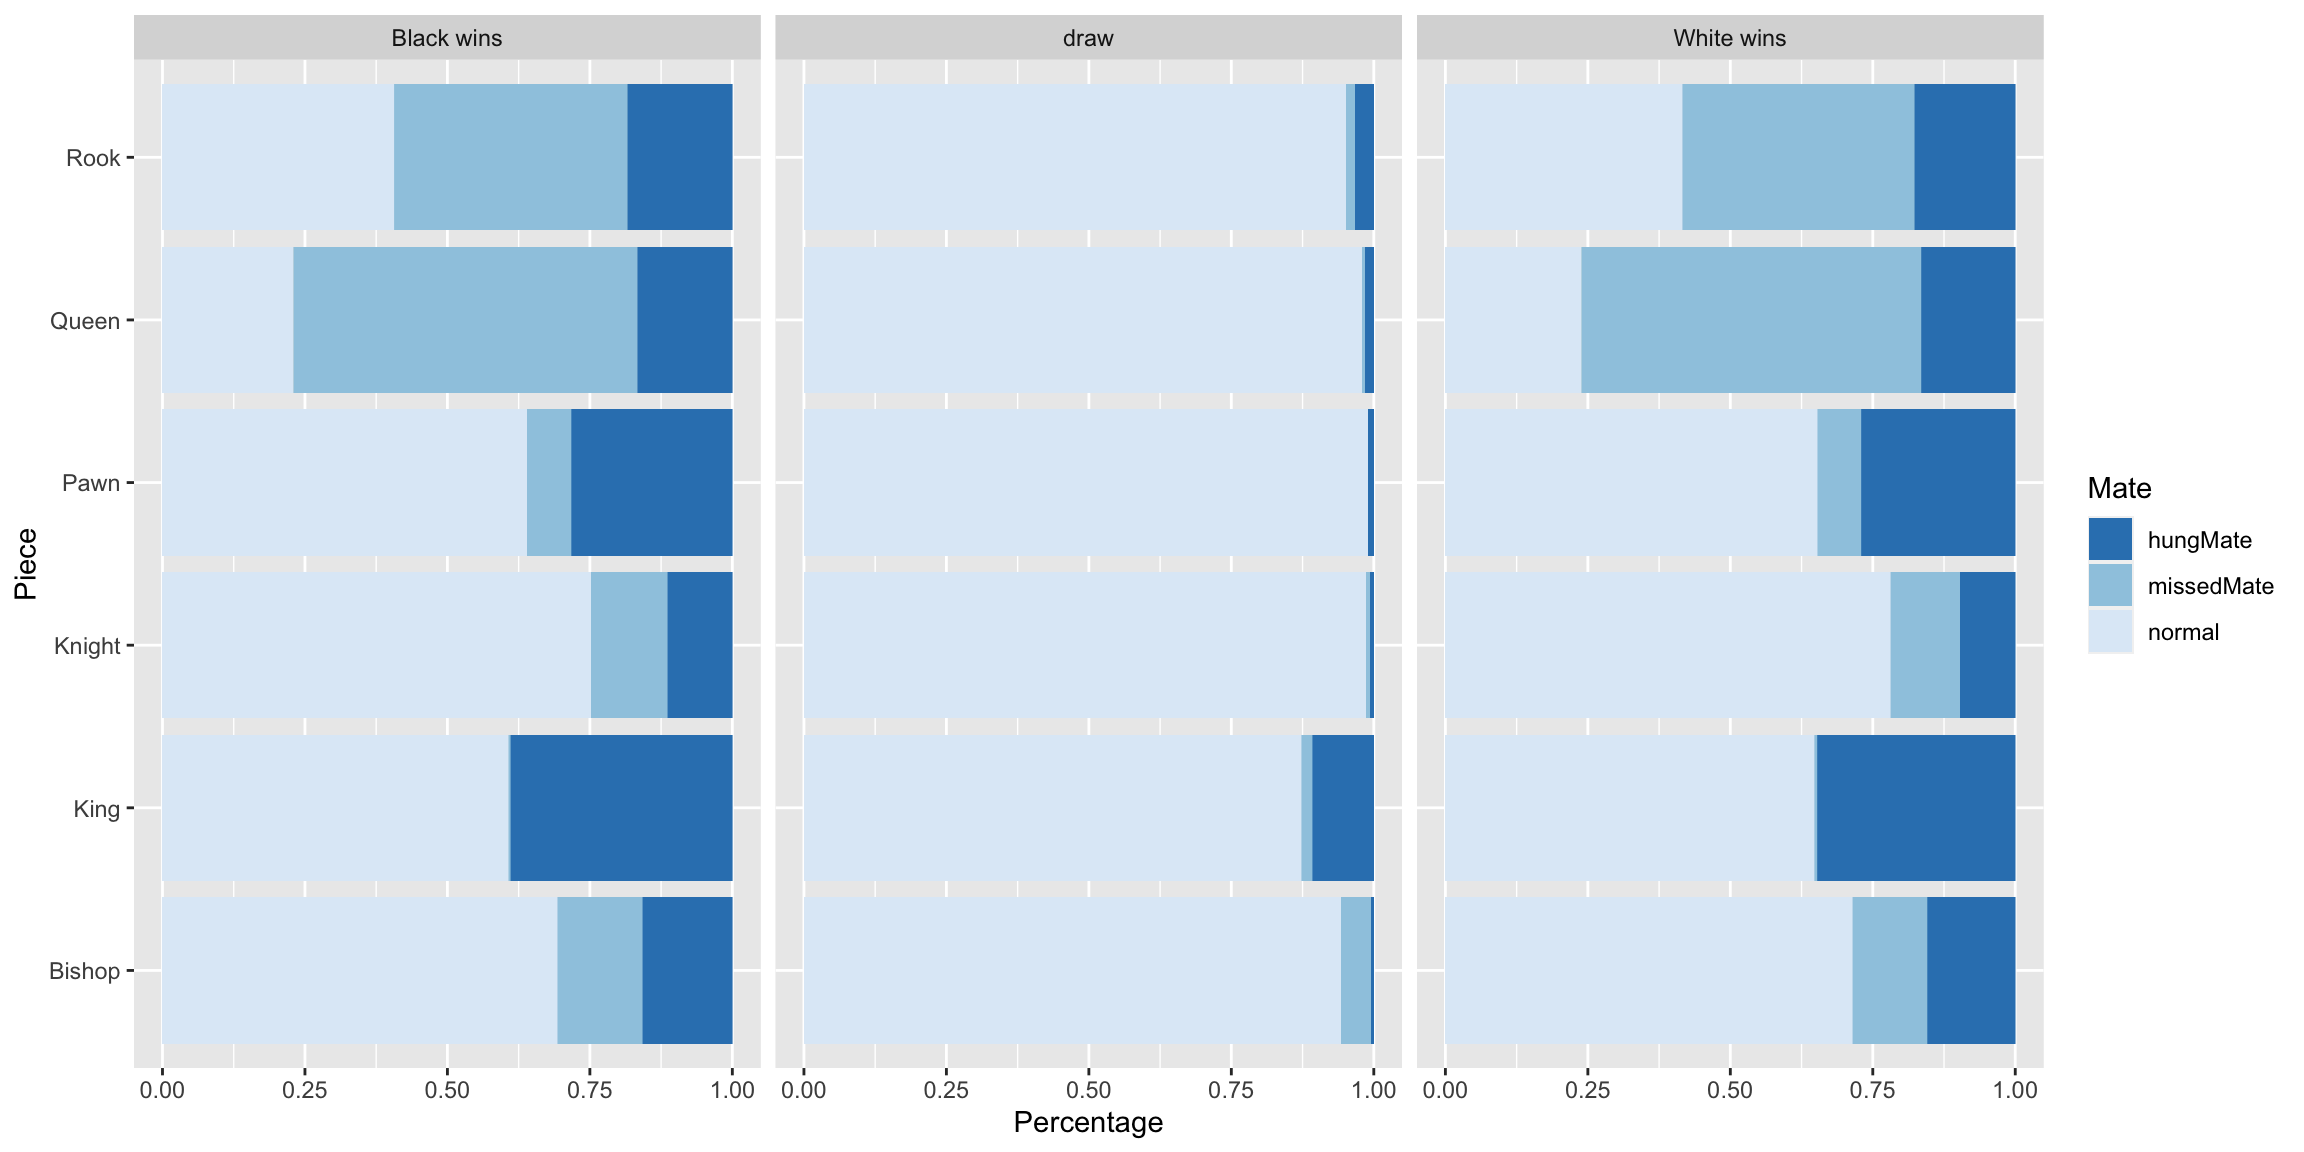
Taking the different kinds of mate into factor and faceting the data by the result, we can see that Black and White side has extremely close distribution for the three types of Mate when it comes to wnning. Knight is the most used piece for a normal mate, followed by Bishop and Pawn. However, if it is a missed mate, Queen would be the most used piece. King would be the most used piece when it is a hung mate.
In games that had results of Draw, the distribution is different with King being the most used one if it is a hung mate.
Please note that Time ratio is scaled-up from 0 to 1 to 0 to 100%:
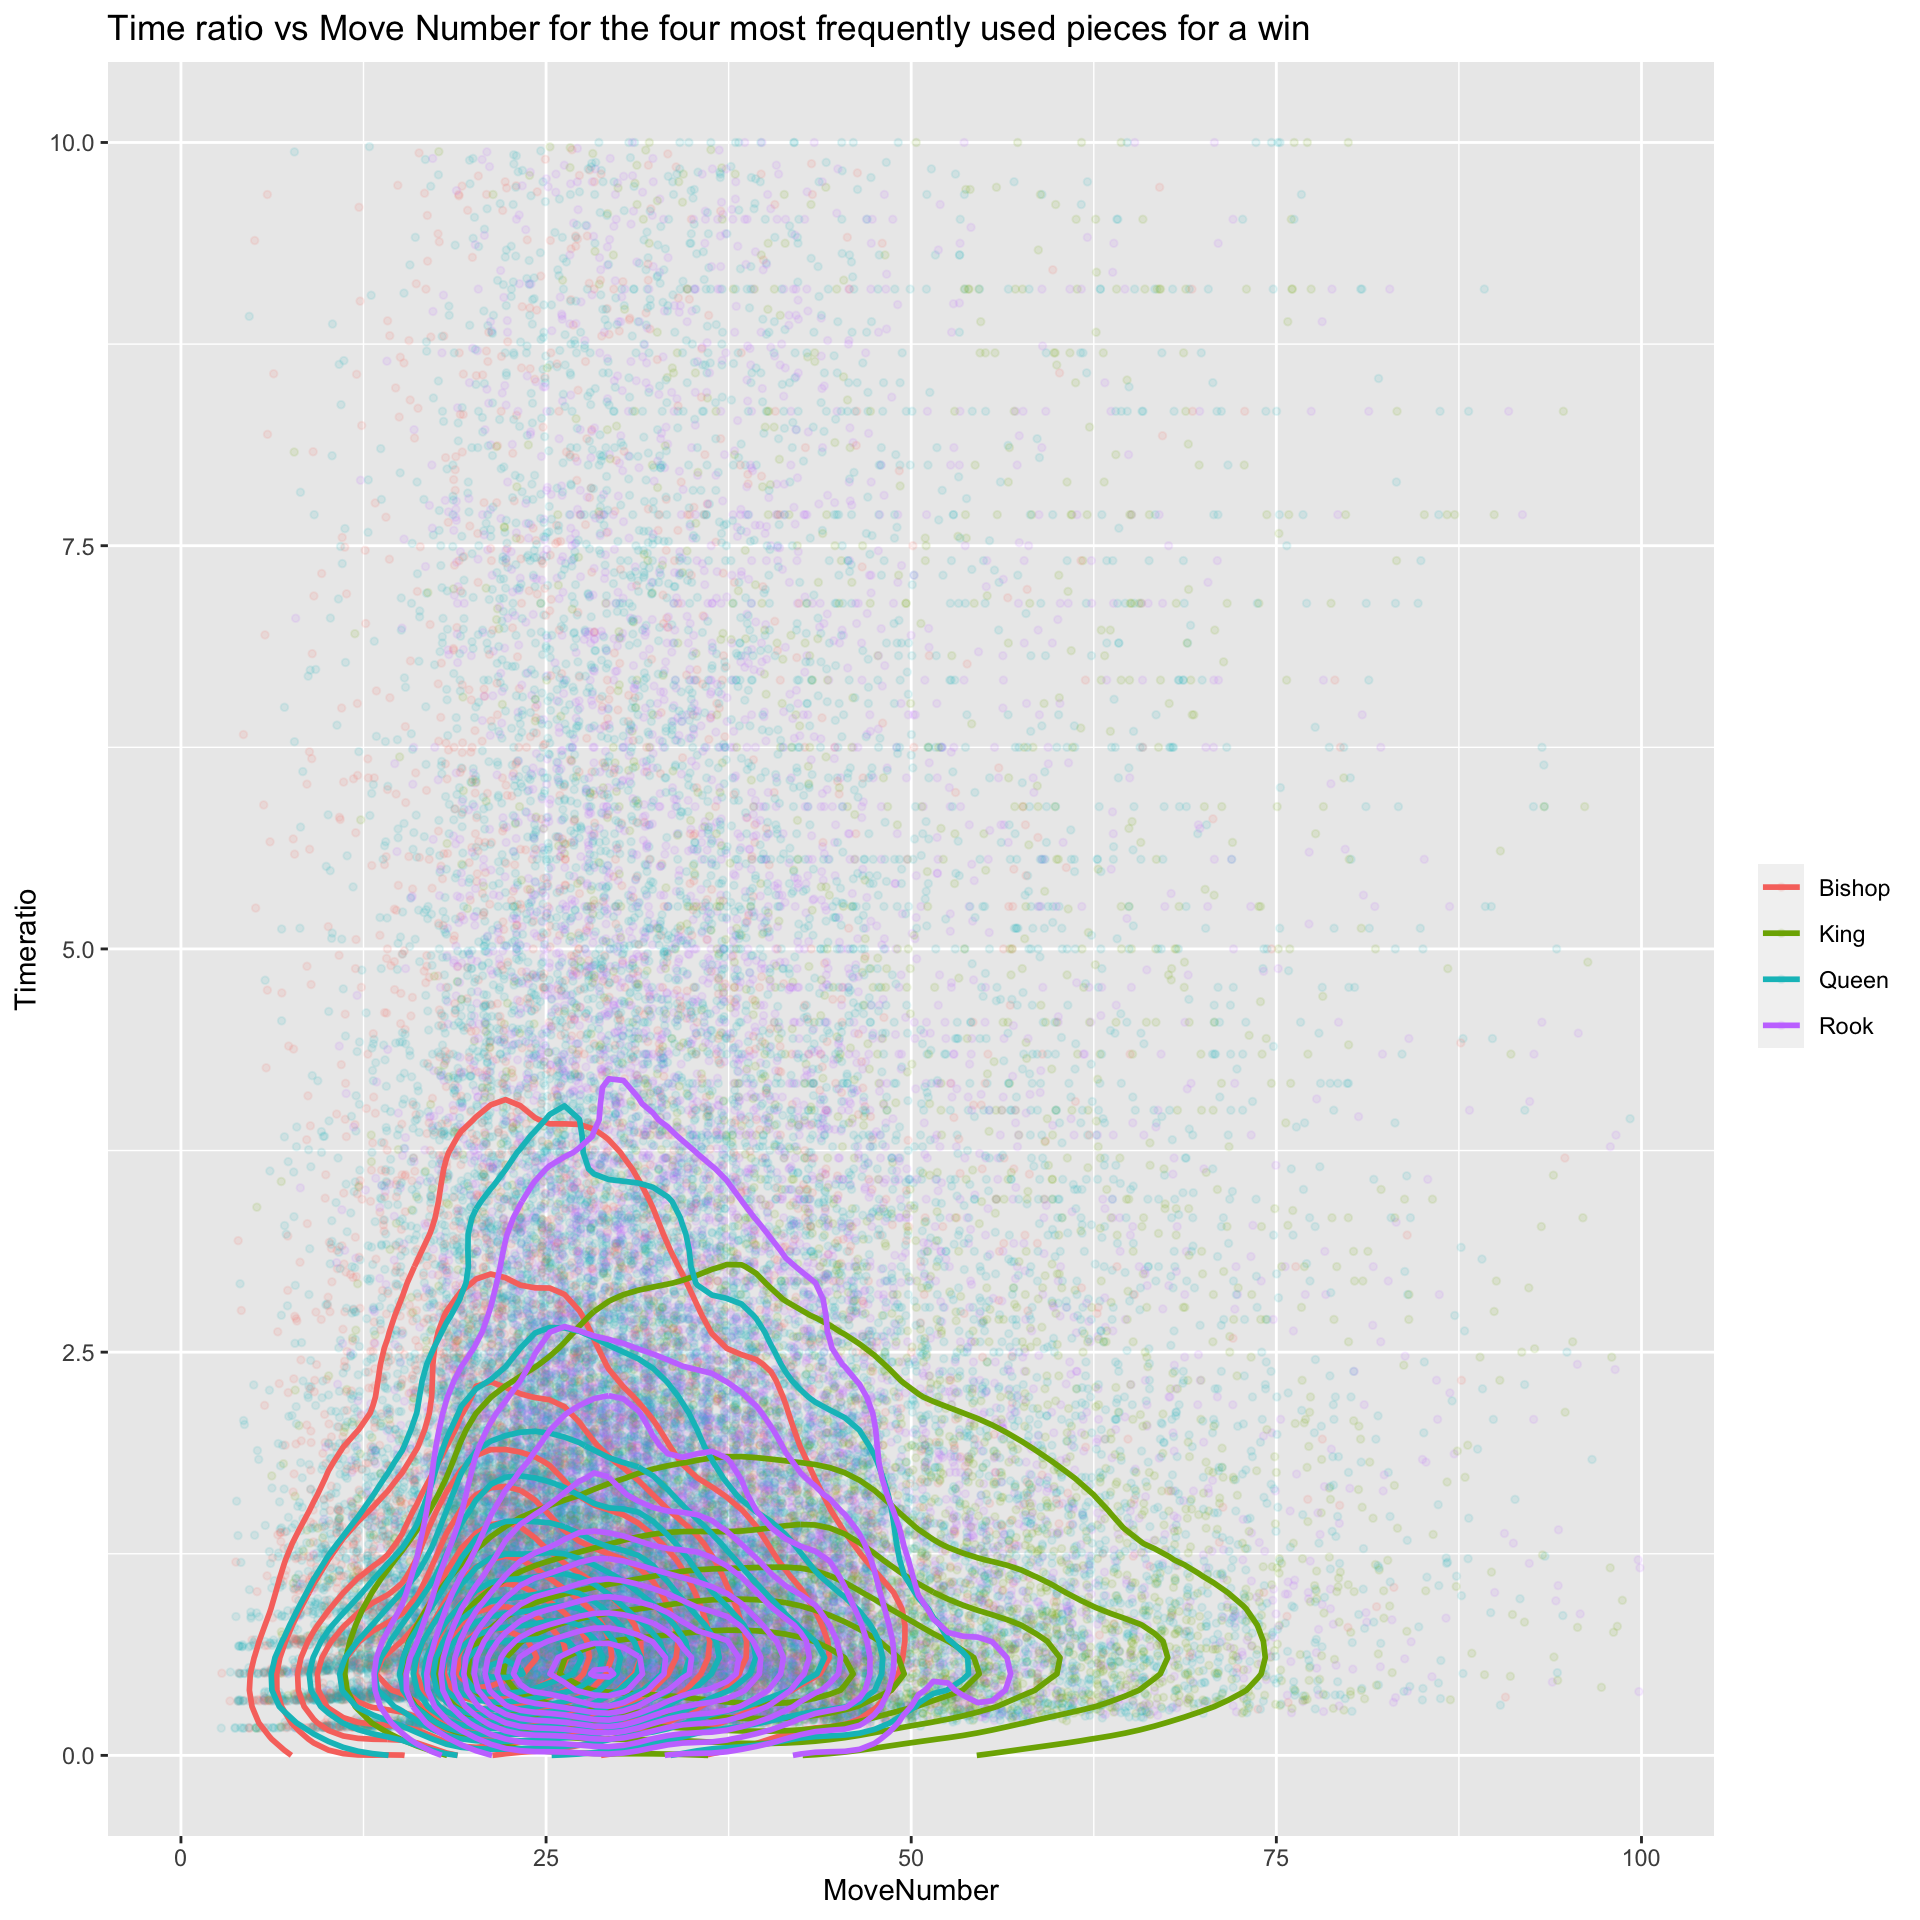
This graph plots with the four most frequently used pieces for winning move. The relationship between Time ratio and Move number gave some extra insights to the use of peices at the end game
As expected, King has the widest span on the Move number axis and has the lowest Time ratio. Long span on the Move number shows that King tends to survive longer as King is the most valuable piece which determines the winner of the game so any move made to it should be thoughtful and careful, thus, a lower time ratio.
With Queen, Rook, and Bishop not being that decisive to the outcome of the game compared to King, we can see all of them has a lower span on the Move number axis.
5.2.2 Time left and time ratio when the losers ran out of time
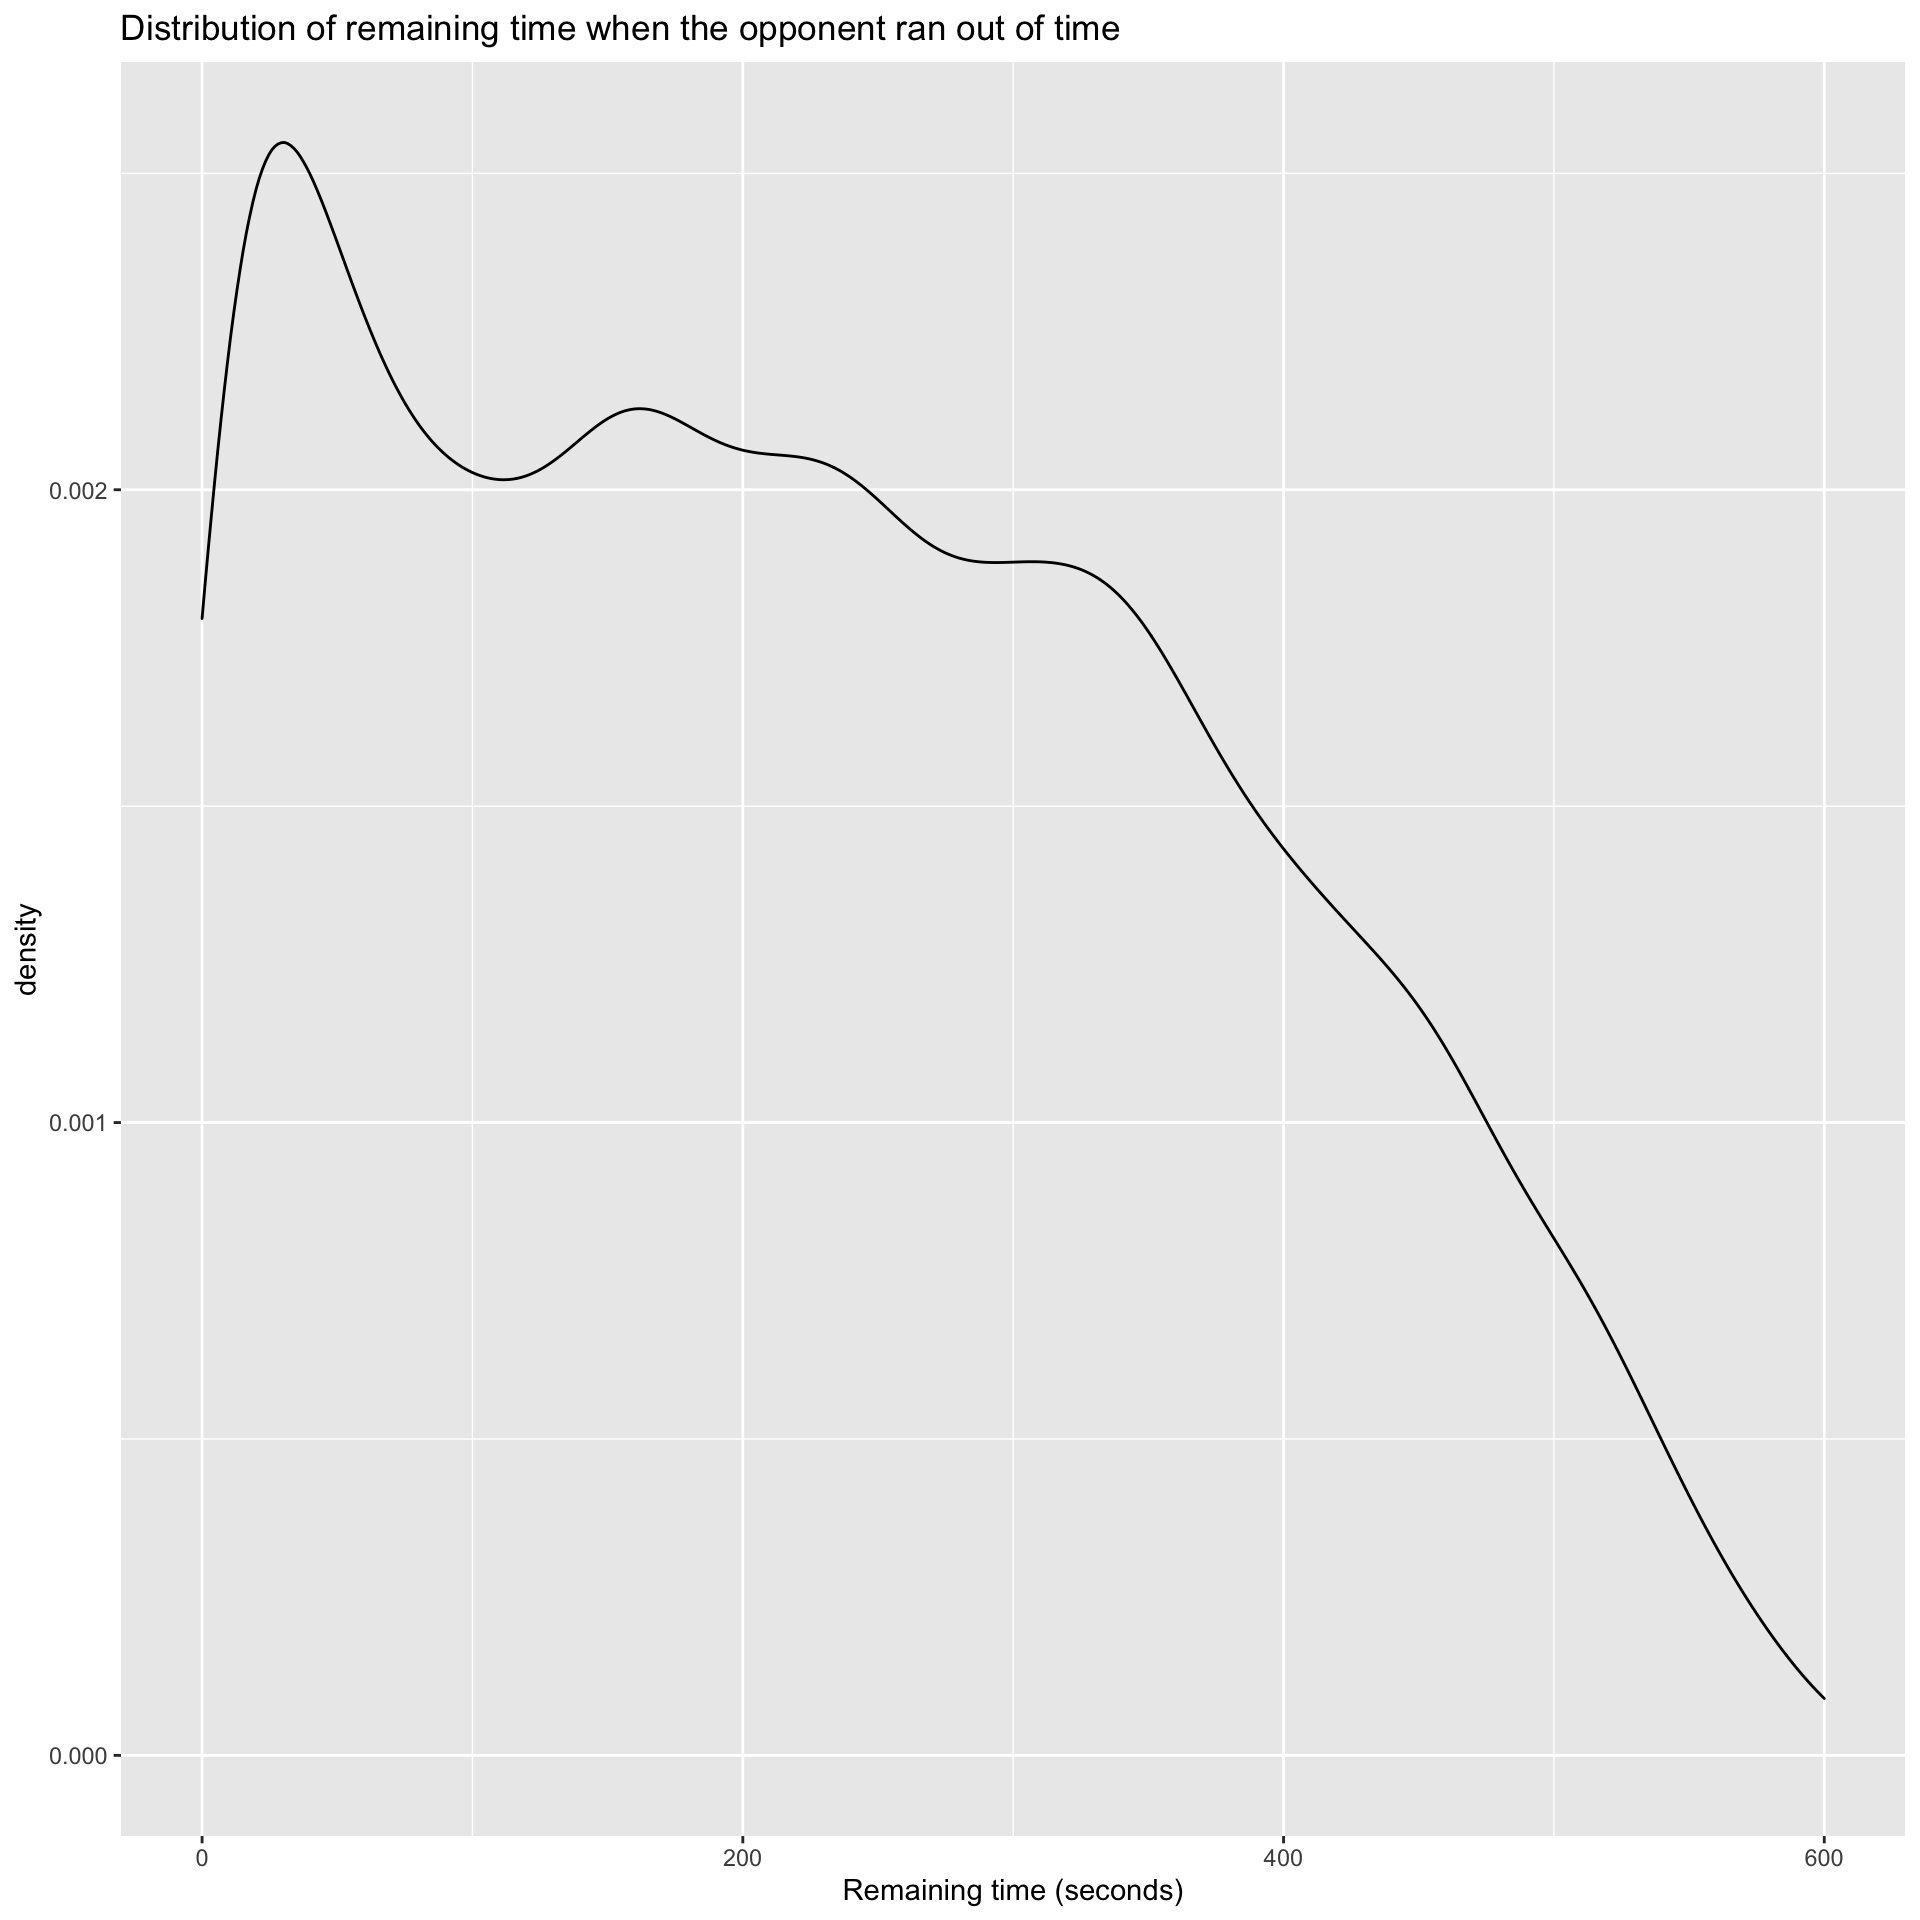
Please note that Time ratio is scaled-up from 0 to 1 to 0 to 100%:
It could be seen that the majority of players who won because their opponent ran out of time had suffucient time left. Most of them had more than 30 seconds left.
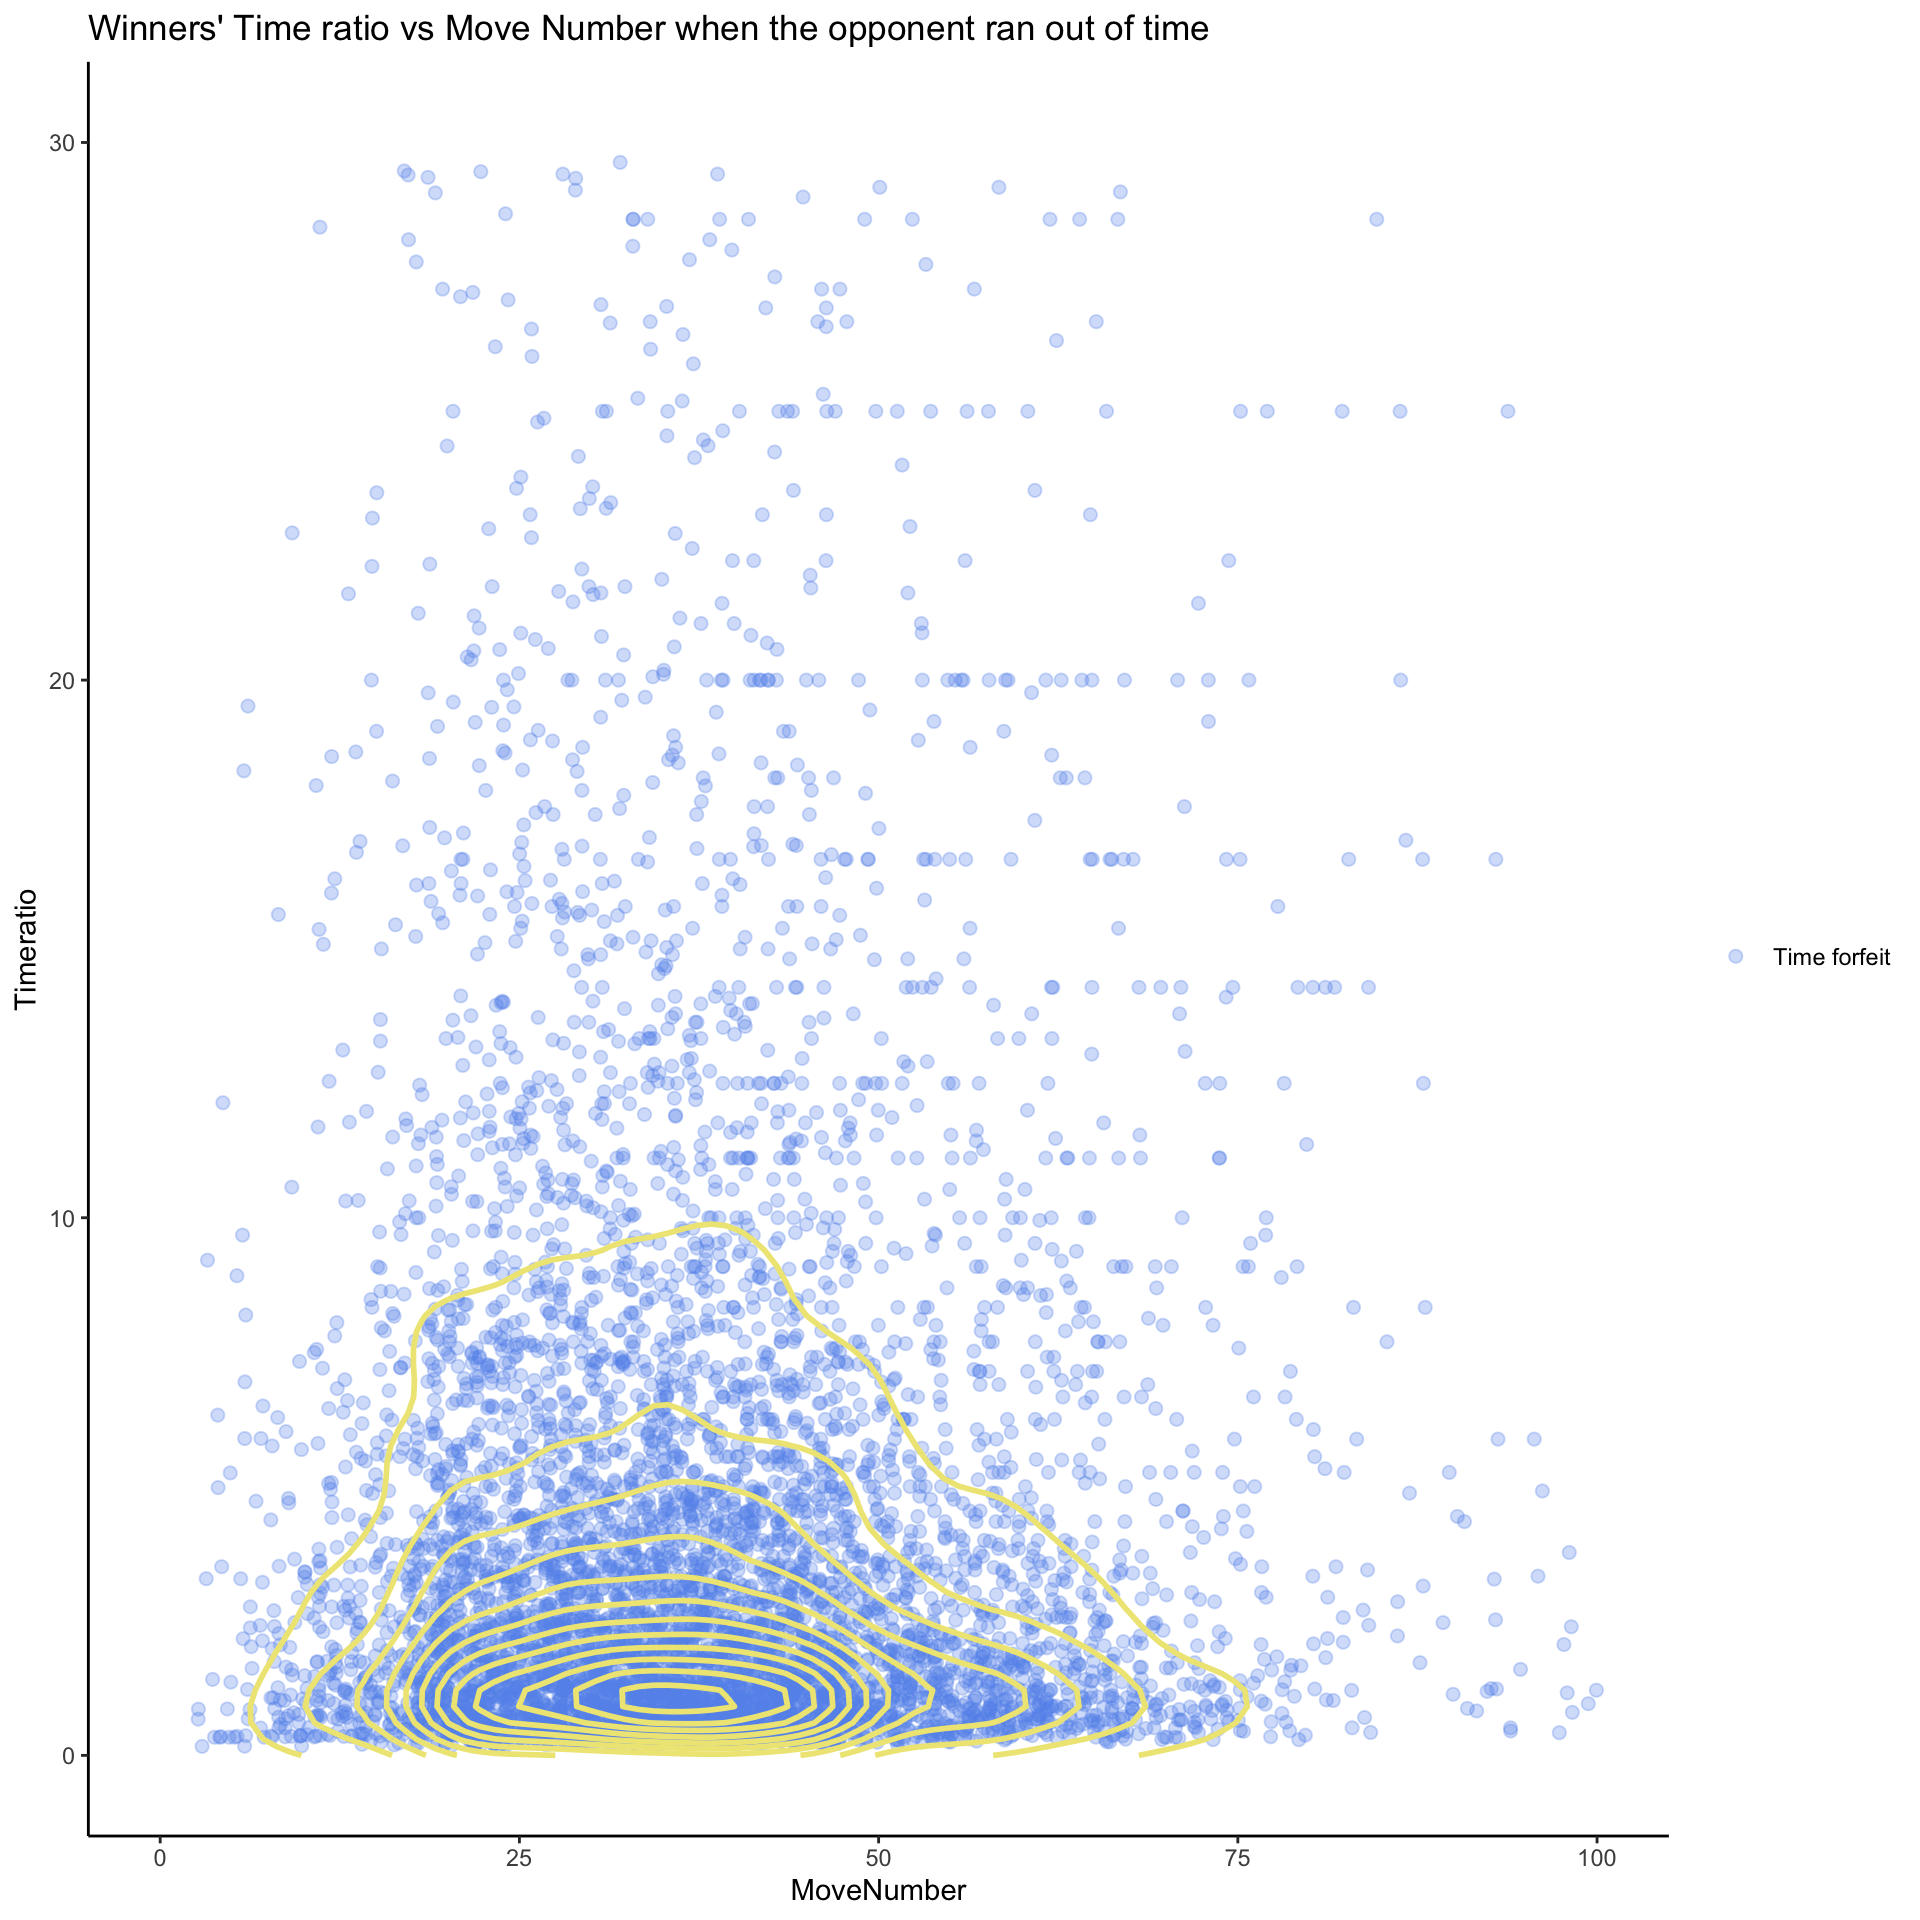
Considering time forfeit games only, time ratio of the winner are mostly below 10% while the density plot shows it concentrated at Time ratio = 0.02 and Move Number = 30.
Also, we could observe that there are less outliers for time ratio when the move number is very high. It was believed that games that have a hugh amount of moves would result in smaller time ratio as there is not much time left.